ebpf 是什么?
对于我来说,最让我感到豁然开朗的解释的是 Brendan Gregg 大师在其博文中提到的:
eBPF does to Linux what JavaScript does to HTML. (Sort of.) … In reality, eBPF is more like the v8 virtual machine that runs JavaScript, rather than JavaScript itself. eBPF is part of the Linux kernel.
实际上我看了很多对于 ebpf 的“正式”释义依旧云里雾里,大师的解释让我对于 ebpf 一下子不再心怀畏惧:认为其需要高深的 Linux 内核知识,需要充分的内核知识储备。
之后我就开始了我的 ebpf 体验之旅,发现确实以我对于 Linux 内核粗浅的认识,一样可以使用 ebpf (当然也得益于 bcc 这一好用的工具),因此记录下我在了解和学习 ebpf / bcc 过程中踩的一些坑。
BPF Compiler Collection (BCC)
BCC 是一个 BPF 编译器集合,包含了用于构建 BPF 程序的编程框架和库,并提供了大量可以直接使用的工具。
BCC makes BPF programs easier to write, with kernel instrumentation in C (and includes a C wrapper around LLVM), and front-ends in Python and lua. It is suited for many tasks, including performance analysis and network traffic control.
如何安装以及环境配置等问题就不多提了,我使用的是 Arch Linux,可以在 Installing BCC 上查看如何在各种Linux 发行版上安装 BCC(对内核要求较高)。
一个 ebpf 程序
 1#!/usr/bin/env python3
 2from bcc import BPF
 3
 4ebpf_c_text = """
 5int kprobe__sys_clone(void *ctx)
 6{
 7 bpf_trace_printk("Hello, World!\\n");
 8 return 0;
 9}
10"""
11
12b = BPF(text=ebpf_c_text)
13print("Your first ebpf Program... Ctrl-C to stop")
14try:
15 b.trace_print()
16except KeyboardInterrupt as e:
17 exit()
这个程序稍微改造了一下 bcc Python Developer Tutorial 的第一个例程,在刚开始学 ebpf 时,我对这个例程感到非常疑惑,仿佛回到了刚学编程的那个时候。可以看出,这里内嵌了一个 C 代码,然后程序本体是Python 代码,然后这个 kprobe__sys_clone 函数的声明也很让人摸不着头脑。
实际上搞懂这些首先需要知道 ebpf 程序是如何开发然后载入内核并执行的,如图所示:
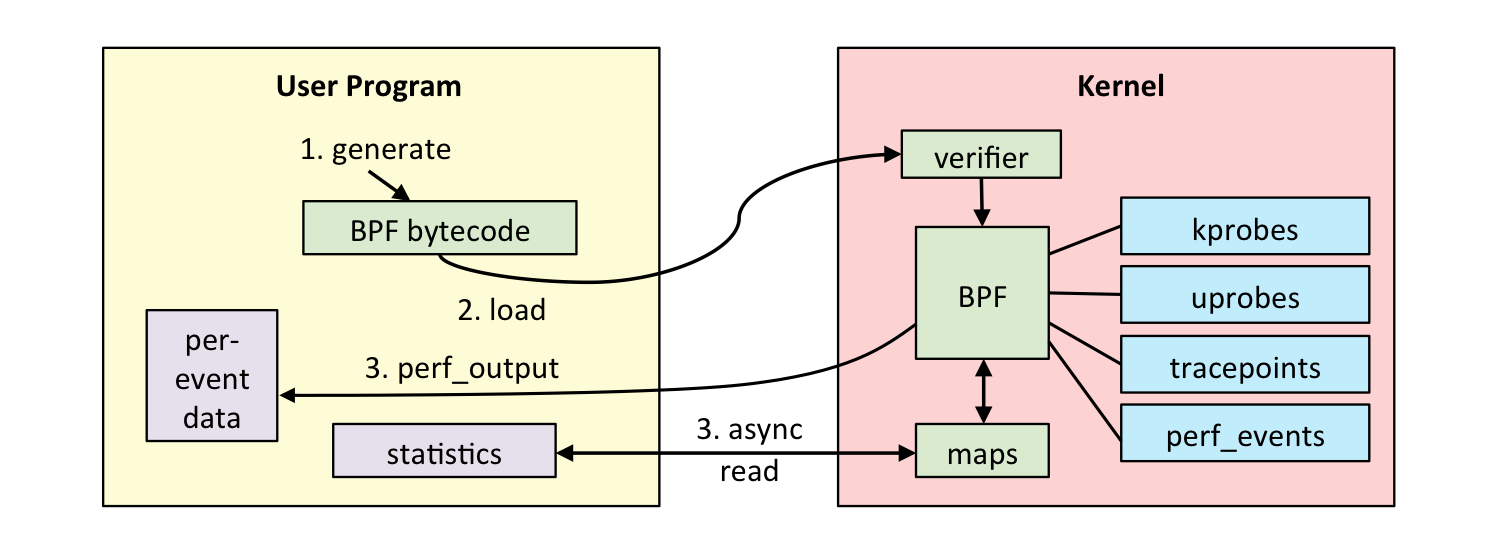
- 使用 C 语言开发一个 eBPF 程序;
- 借助 LLVM 把 eBPF 程序编译成 BPF 字节码;
- 通过 bpf 系统调用,把 BPF 字节码提交给内核;
- 内核验证并运行 BPF 字节码,并把相应的状态保存到 BPF maps 中;
- 用户程序通过 BPF maps 查询 BPF 字节码的运行状态。
当然这几步你可以手动去完成,但是显然 BCC 抽象了这一过程,例程中只要完成第 1 步 和第 5 步即可。这里的 ebpf_c_text 就是 C 开发的一个 eBPF 程序,之后就是 BCC 来完成第2/3步,用 Python 完成数据的读取(当然这里还没有用到 bpf 的 maps)。到此为止,这个 Python 程序的大题框架我们已经认识。还有一些细节我们没理解。我们先看看运行结果:
1chmod +x first_ebpf.py
2./first_ebpf.py #需要root权限或 sudo ./first_ebpf.py
Output:
1Your first ebpf Program... Ctrl-C to stop
2b' zsh-27651 [024] d..31 184376.953730: bpf_trace_printk: Hello, World!'
3b' zsh-27651 [024] d..31 184377.212267: bpf_trace_printk: Hello, World!'
4...
5^C
我们知道,clone 是创建子进程系统调用,因此当有进程创建子进程,例如输入 ls 命令,就会触发这个 ebpf 程序。输出如上所示。
剩下的问题就是理解程序到底做了什么(文档链接):
-
int kprobe__sys_clone(void *ctx):kprobe__is a special prefix that creates a kprobe (dynamic tracing of a kernel function call) for the kernel function name provided as the remainder. You can also use kprobes by declaring a normal C function, then using the PythonBPF.attach_kprobe()(covered later) to associate it with a kernel function.Arguments are specified on the function declaration: kprobe__kernel_function_name(struct pt_regs *ctx [, argument1 …])
The first argument is always
struct pt_regs *, the remainder are the arguments to the function (they don’t need to be specified, if you don’t intend to use them).kprobe__ 是一个特殊的前缀,用来追踪其后缀代表的内核函数调用,其第一个参数固定为
struct pt_regs *ctx,其余参数是待追踪的函数的参数(如果不打算使用它们,则不需要指定它们)。 -
bpf_trace_printk():bpf_trace_printkis a simple kernel facility for printf() to the common trace_pipe (/sys/kernel/debug/tracing/trace_pipe).可以把
bpf_trace_printk()简单理解为 ebpf 专用的 printf,但是有许多限制,一般只在调试时使用(参考文档) -
BPF()Creates a BPF object. This is the main object for defining a BPF program, and interacting with its output.
创建一个 BPF 对象,完成上述的第 2/3 步。
-
b.trace_print()This method continually reads the globally shared /sys/kernel/debug/tracing/trace_pipe file and prints its contents.
trace_print() 持续读取全局共享的 /sys/kernel/debug/tracing/trace_pipe 文件并打印其内容。显然该方法是对应
bpf_trace_printk()的用户态程序,ebf 在内核写入到 trace_pipe,python 程序在用户态不停的读取。
这几个核心的函数解释完成,程序的逻辑也就不难理解了:每当 sys_clone 被调用,ebpf 程序输出一个Hello World 到 trace_pipe ,然后 Python 持续读取 trace_pipe 并输出。
待续…
Reference
eBPF Documentation: What is eBPF?